
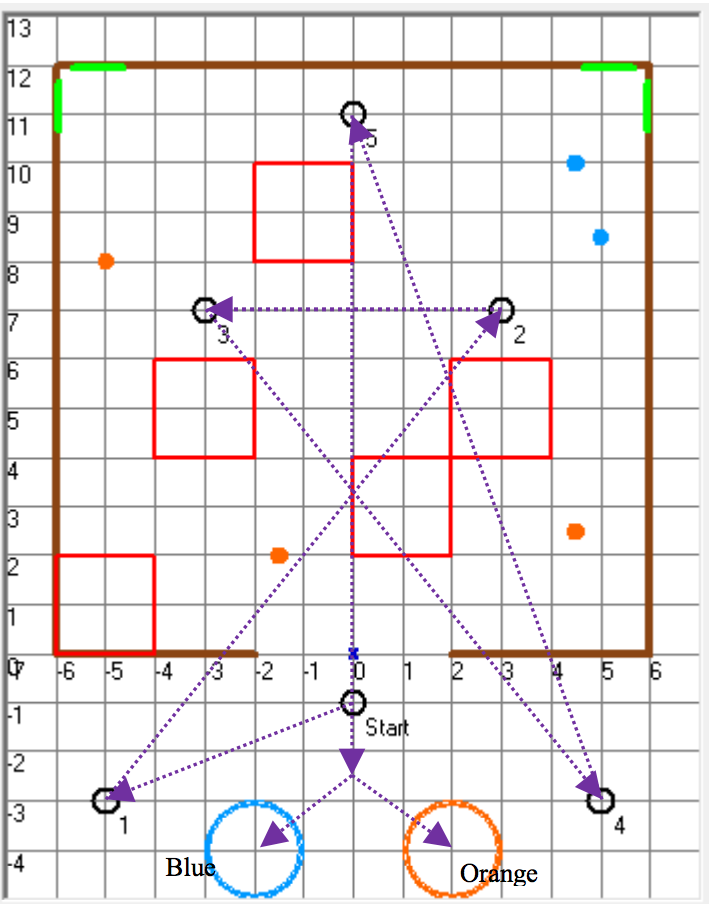
The goal of this project is to program our robot to navigate to five different (x, y) points in their numbered order. Along the way to these five points locate and imaginatively “spray with herbicide” at least two of the five brightly colored "weeds" dispersed in the course and avoid the obstacles in your robot’s path. Once all five points have been reached, if needed we continue locating and spraying weeds and then report the number of pink weeds found at the pink reporting circle and the number of blue weeds found at the blue reporting circle. An image of a possible map with the compulsory waypoints is given below:
The team decided to use A* algorithm for path planning. The LADAR on the robot detects obstacles and updates the map accordingly. A* is then used to plan path to reach from one way point to another. However, the robot dismisses A* in two situations. First situation is when the robot is outside the arena, the robot is programmed to go directly to waypoints as no obstacle is expected there. The second situation is when the robot finds a ‘weed’ using its camera. The weed detection and ‘extermination’ is discussed in a later segment. Finally, the A* algorithm was modified to create a ‘virtual wall’ in the center of the arena to force the robot to move along the boundary if possible. This was implemented by adding a high positive penalty term to the cost (heuristic distance + distance travelled from start) for central grid cells. This strategy enabled the robot to explore more regions for exterminating all weeds.
The team utilized a standard RGB camera to detect the blue and pink weeds that needed to be exterminated. The system was first trained in order to detect these weeds by determining an adequate hue, saturation, and value such that only the colors of the weeds would be detected and nothing else such as the surrounding walls using a Matlab script provided by Prof. Block. These values were used in a color vision detection algorithm that was ran every 20 milliseconds to search for color within the field of view of the robot. This algorithm looped through all of the pixels in the image and yielded useful information such as the location of the pixel centroid of the largest object as well as the number of pixels in that object, and the process was alternated every time looking for pink or looking for blue. Half of the pixels of the image from the top were not used in the calculation to minimize the likelihood of detecting a person or object outside of the arena, and 5 pixels were cut-off from the remaining sides to account for damaged pixels around the edges of the camera. The distance from the robot to the weed when the weed was directly in front of the robot was determined empirically based off of the pixel centroid by placing the weeds at different distances and modeling the data points to a cubic function. All of this was combined to perform the detection and extermination of the weeds. While the robot is performing A*, if the color vision algorithm detects a color centroid with a pixel count large enough, the robot will first stop performing A* and will center itself on the weed by turning until the centroid of the weed is within a small tolerance of the center of the camera , which ensures that the weed is along the same axis as the robot so it can be given the same coordinate. The distance away the weed is from the robot is then calculated using the cubic function that was derived yielding the distance away from the weed. Once the location of the weed is in determined in the robot’s coordinate frame, a transform is performed to determine the location of the weed in the world frame. If the weed has not already been exterminated, the robot will dead-reckon with a velocity of .6 tiles per second to exterminate the weed. If the weed has already been exterminated, the robot will ignore the weed and then continue to A*.
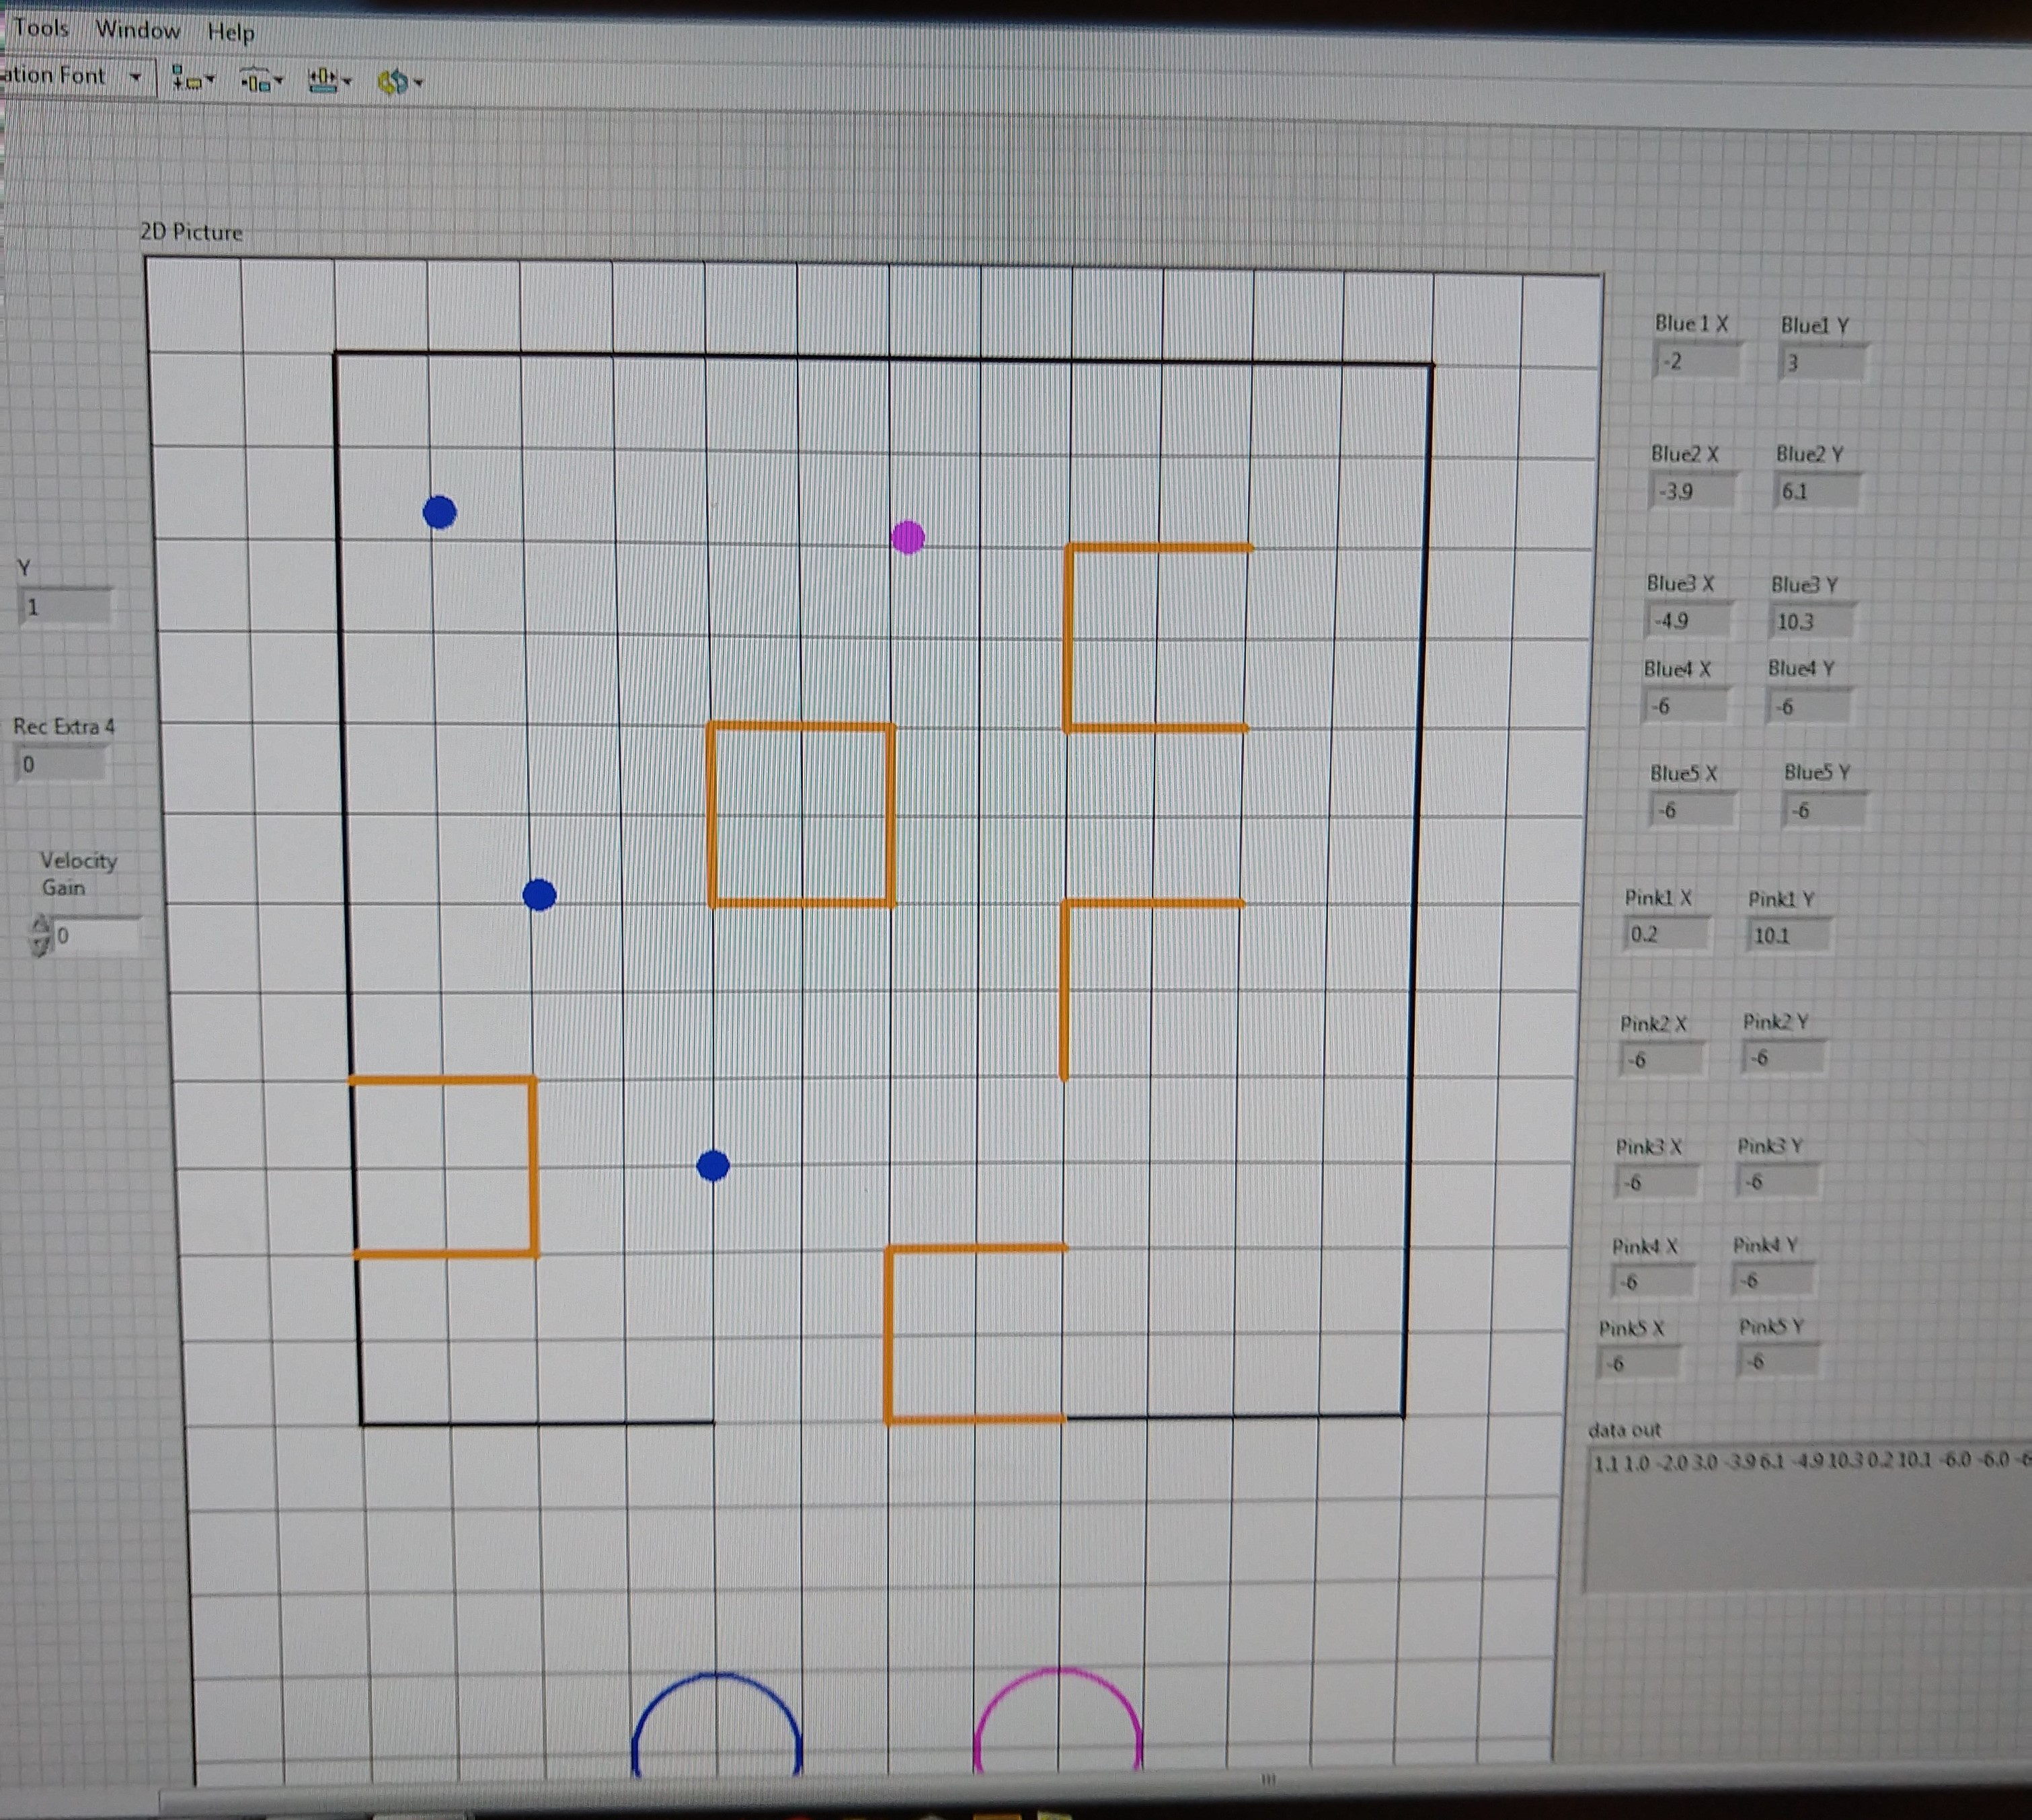
The Labview VI for our robot has multiple components. On the front panel, the user sees a stop button, a display history button, the x and y coordinates of the robot and those of each pink and blue weed found, and a gridded arena. While the robot drives, the front panel displays the outline of the course and the location of the robot as well as the location of the obstacles and weeds. The weeds are displayed as pink and blue dots respectively, while the obstacles are drawn as lines when they are discovered by the robot. The x and y coordinates of the robot and those of the weeds are sent up to Labview directly. A conversion then takes place to translate those coordinates to the reference frame of the Labview VI. Similarly, the x and y coordinates of the center of an obstacle are sent up to Labview and converted to the Labview frame of reference. The obstacle center locations are then used to generate lines. For the case of the vertical obstacles, two vertical lines (one in each direction) are drawn fifty pixels from the center point in order to generate the two tile line defined as an obstacle. The same is performed for the horizontal lines. Lastly, two circles are displayed at the bottom of the program where the robot shows how many weeds of each color the robot detected. The figure below shows the Labview that was run during the contest.
From left to right: Ken Cooley, Varun Jain, Dylan Charter, Ayush Sinha, Joshua Brooks

A video of our final performance is embedded below.